Automatically Spin up Graphical representations of All logging activities in your environment

(Graph the frequency of events, # of matching keywords / patterns, log size, # of new entries added to a log, variations in log update times and much more!)

Auto Inspect all log monitoring graphs for unusual trends and Alert on anomalies!

http://www.logrobot.com/dashboard-view-logxray.PNG

How healthy is my Application, Database or System right now?

http://www.logrobot.com/overview-of-application-errors.PNG

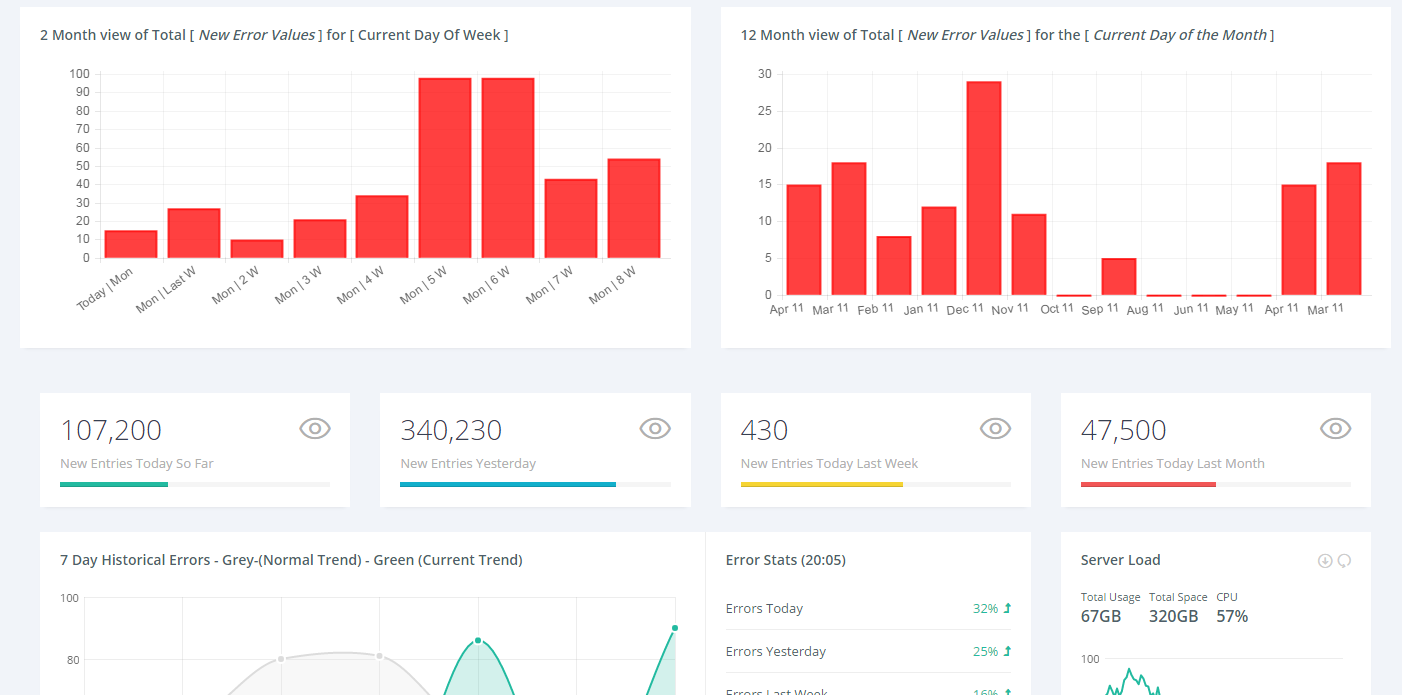
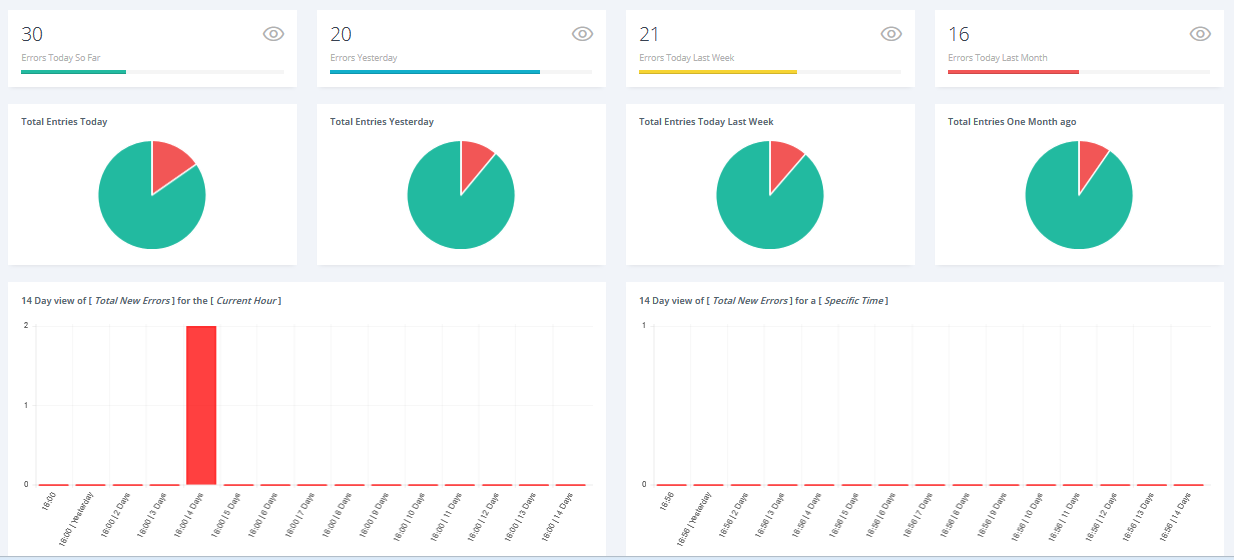
Historical trend of how my application is functioning

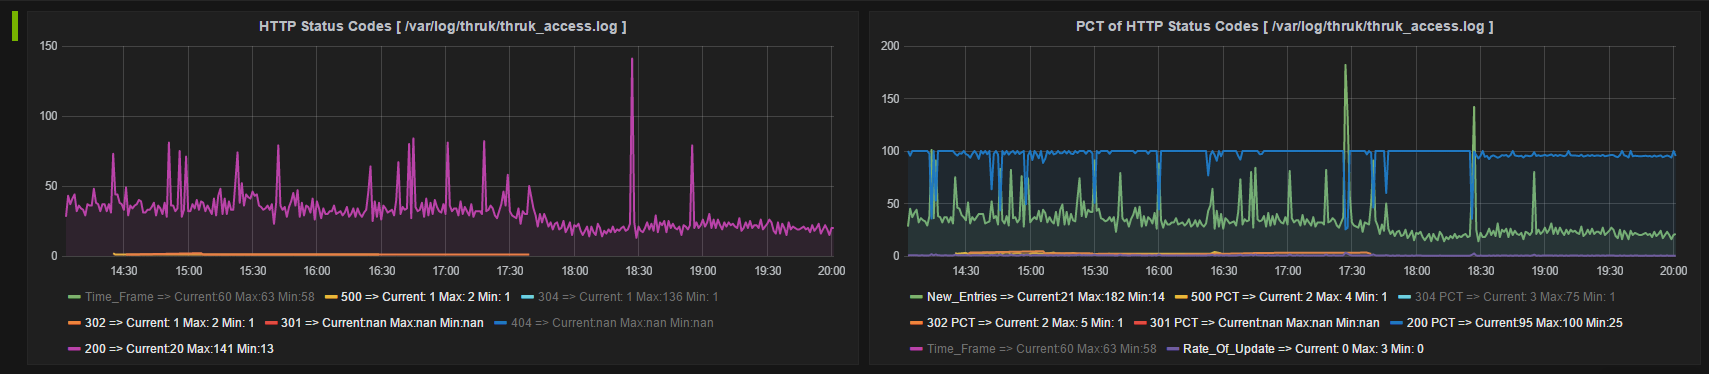
Graphing http status codes:


NOTE:  The graphs you see above were automatically generated by the following one-liner (notice the simplicity):

  • ./logxray localhost /var/tmp/logXray,graphite,127.0.0.1:8125 autonda /var/log/apache2/graphite-web_access.log 60m '.' '.' 1 2 apache_status_codes  -ndfoundapachen

    The above one liner can either be placed in Crontab or run through Nagios (or through other monitoring applications..Zabbix, Zenoss, Sensu...etc). 


    The most important information you will need to provide for this to work is:


    1. The IP of your Graphite host and

    2. The port number for Statsd on the Graphite host

Here's a complete explanation of what each parameter means:

  • logxray = this is the magical log monitoring tool that makes your life tremendously convenient

  • localhost = this is a default parameter that should be set for all log monitoring setup

  • /var/tmp/logXray = this is the directory logXray will use to store its processing data

  • graphite = By specifying this, we are saying we want graphite graphs to be generated for this check

  • 127.0.0.1 = This IP specifies the host on which graphite is running - In this case, it is running on our local box

  • 8125 = This is the port to send statistics to on the graphite host so graphs are in fact generated

  • autonda = This is the feature that allows logxray to scan any log file regardless of log's content format, size, or type

  • /var/log/apache2/graphite-web_access.log = This is the actual http log file we want to scan for http status codes

  • 60m = This is the age the above mentioned log file must be for logxray to decide to scan it – if log is older than this age, logxray will not scan it

  • ‘.’ ‘.’ = We are saying here that we want to graph the frequency of every single status code that is found in the http log file

  • 1 = If the sole purpose for this check is just to generate graphs and not send alerts, this Warning parameter has no effect.  It must be set nevertheless.

  • 2 = Same thing here.  This Critical threshold has no effect, but must be set nevertheless.  You can just pick any random number greater or equal to 1.

  • apache_status_codes = This is the name of the application under which graphs will be created in Graphite

  • -ndfoundapachen = This is the option that allows you to scan apache / http type log files


Copyright        |        Restrictions        |        Licensed Product        |        Grant of License        |        License Agreement